Cell Cycle Phase Distribution
Transcriptomics / Single-cell RNA-seq / Cell cycle analysis
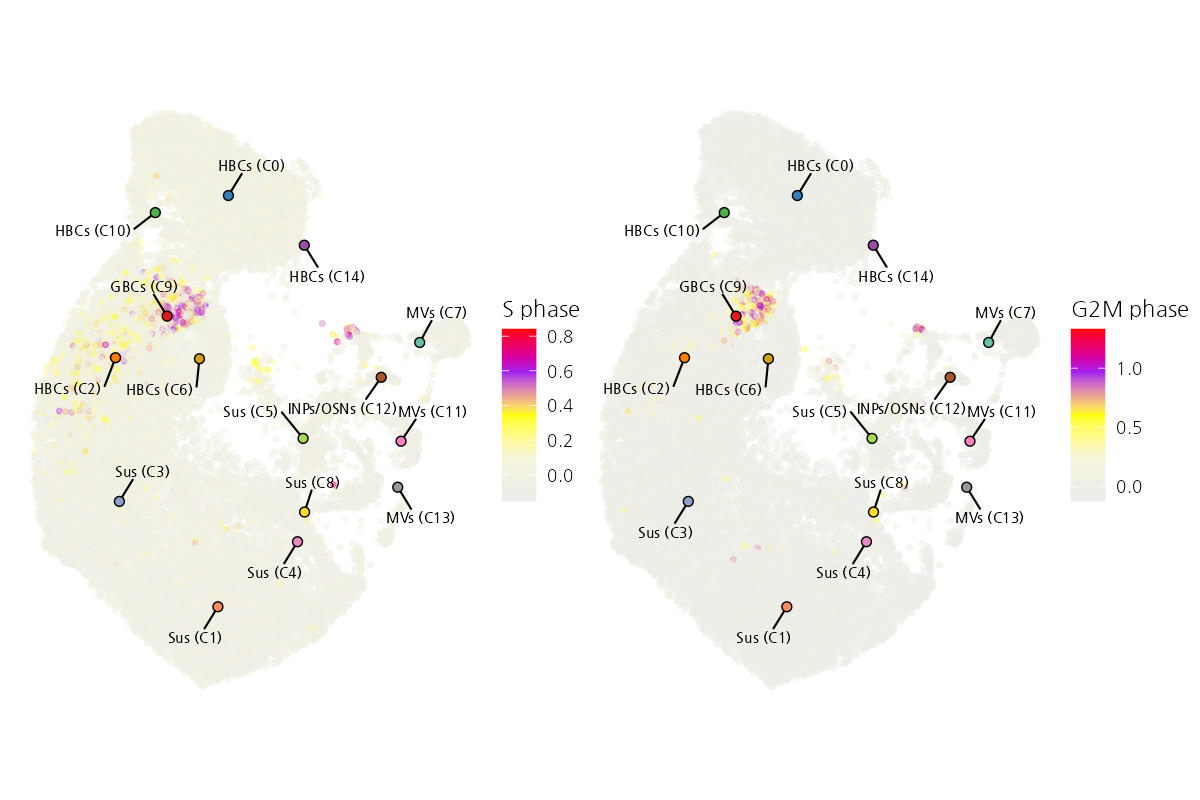
This plot illustrates the distribution of various cell types across two cell cycle phases, S phase and G2M phase. The left panel represents S phase, while the right panel shows G2M phase. Colors indicate the intensity of each phase, with a gradient from yellow (low) to red (high) for S phase and yellow to purple for G2M. Different cell clusters are labeled, highlighting their phase-specific characteristics and spatial organization.