Gene Expression Comparison Across Conditions
Transcriptomics / Bulk RNA-seq / Specific gene expression
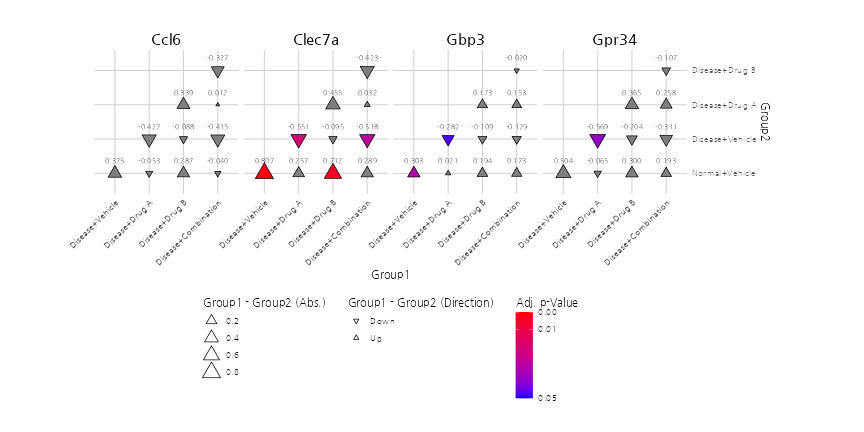
The plot compares gene expression of Ccl6, Clec7a, Gbp3, and Gpr34 across different conditions such as Disease, Drug, and their combinations. Upward and downward triangles indicate the direction of expression change, with colors representing the adjusted p-value significance.