Bulk RNA-seq
We offer comprehensive bulk RNA-seq analysis, from basic steps such as quality control, alignment, and differential expression to advanced analyses including gene set enrichment, pathway analysis, and transcription factor inference. Our pipeline enables high-resolution biological insights and has supported numerous peer-reviewed publications.
Workflow Summary
  ---
config:
    theme: 'base'
    themeVariables:
        fontFamily: 'verdana'
        fontSize: '25px'
---
flowchart LR
    subgraph Preprocessing["`**Preprocessing**`"]
        direction TB
        Raw[Raw Reads]
        QC[Quality Control]
        Align[Alignment]
        Quant[Quantification]
        Raw --> QC --> Align --> Quant
    end

    subgraph Basic["`**Basic Analysis**`"]
        direction TB
        Norm[Normalization]
        PCA[Principal Component Analysis]
        DEG[Differential Expression]
        Vis[Visualization]

        Norm --> PCA --> DEG --> Vis
    end

    subgraph Advanced["`**Advanced Analysis**`"]
        direction LR
        GSEA(Gene Set Enrichment)
        Pathway[Pathway Analysis]
        PPI[Protein Interaction Network]
        Deconv[Cell Type Deconvolution]
        TF[Transcription Factor Analysis]
        Pseudo[Pseudotime Analysis]
        Coexp[Co-expression Network]
        Compare[Comparative Enrichment]
        Drug[Drug Connectivity Mapping]
        CustomVis[Custom Visualization]

        GSEA --> CustomVis
        GSEA --> Compare --> CustomVis
        Pathway --> CustomVis
        PPI --> CustomVis
        Pathway --> PPI --> CustomVis
        Deconv --> CustomVis
        TF --> CustomVis
        Pseudo --> CustomVis
        Coexp --> CustomVis
        Drug --> CustomVis
    end

    Preprocessing --> Basic --> Advanced
Preprocessing
- Quality Control – Raw reads are trimmed and filtered.
- Alignment – Reads are aligned to the reference genome.
- Quantification – Gene-level count matrices are generated.
Basic
- Normalization – Count data is normalized (e.g., DESeq2).
- Principal Component Analysis (PCA) – PCA is performed to visualize sample clustering.
- Differential Expression – DEGs are identified with statistical testing.
- Visualization – PCA, volcano plots, and heatmaps are created.
Advanced
- Gene Set Enrichment – Enrichment analysis for biological processes (GO), diseases (DO), and cell types using curated gene sets.
- Pathway Analysis – Identification of enriched pathways from KEGG, Reactome, and WikiPathways databases.
- Protein Interaction Network – Construction of protein-protein interaction networks using STRING, BioGRID, or IntAct.
- Cell Type Deconvolution – Estimation of cell-type proportions in bulk RNA-seq using reference-based deconvolution methods (e.g., CIBERSORTx, MuSiC).
- Transcription Factor Analysis – Prediction of key regulators via TF-target enrichment (e.g., using DoRothEA, RcisTarget).
- Temporal or Pseudotime Analysis – Inference of time-dependent or developmental trajectories from bulk data (e.g., with psupertime or tradeSeq).
- Gene Co-expression Network – Construction of co-expression modules (e.g., with WGCNA) to explore gene modules related to traits.
- Comparative Enrichment – Side-by-side comparison of enriched terms between multiple contrasts or conditions.
- Drug Connectivity Mapping – Prediction of potential drug candidates by comparing expression profiles to perturbation databases (e.g., LINCS).
- Custom Visualization – Publication-ready plots including enrichment bar/ball plots, enrichment maps, and network visualizations.
Example
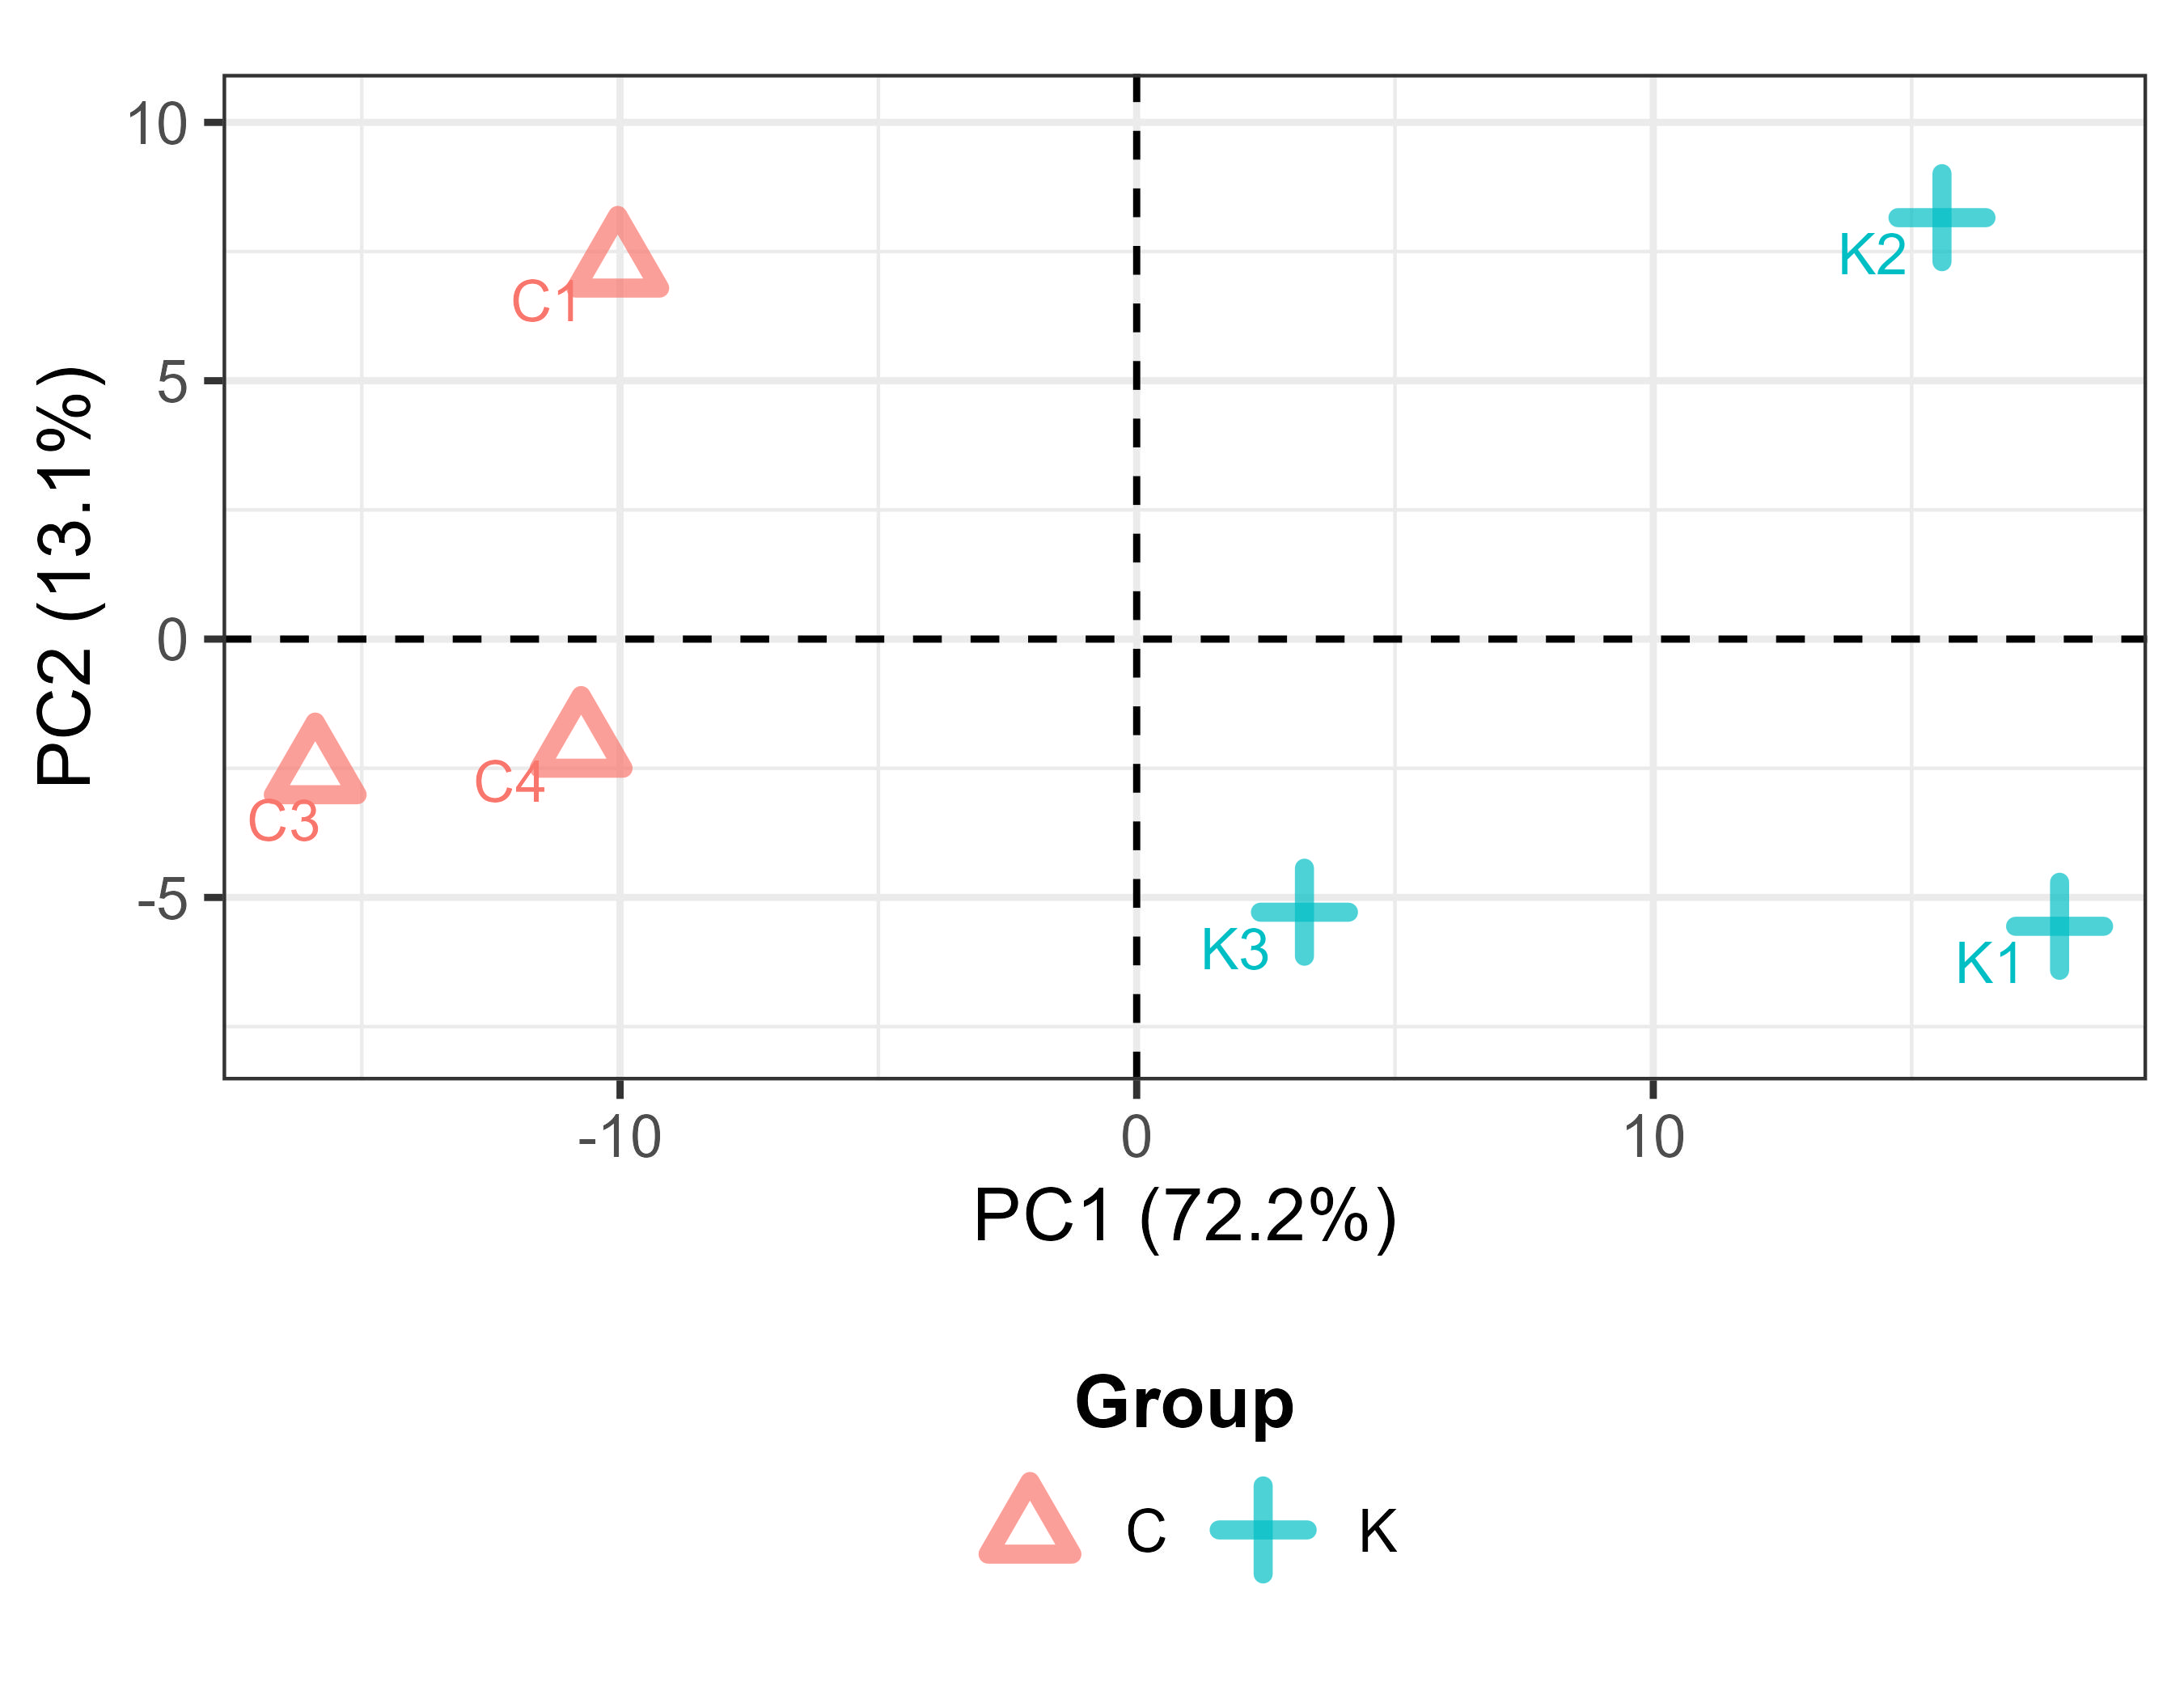
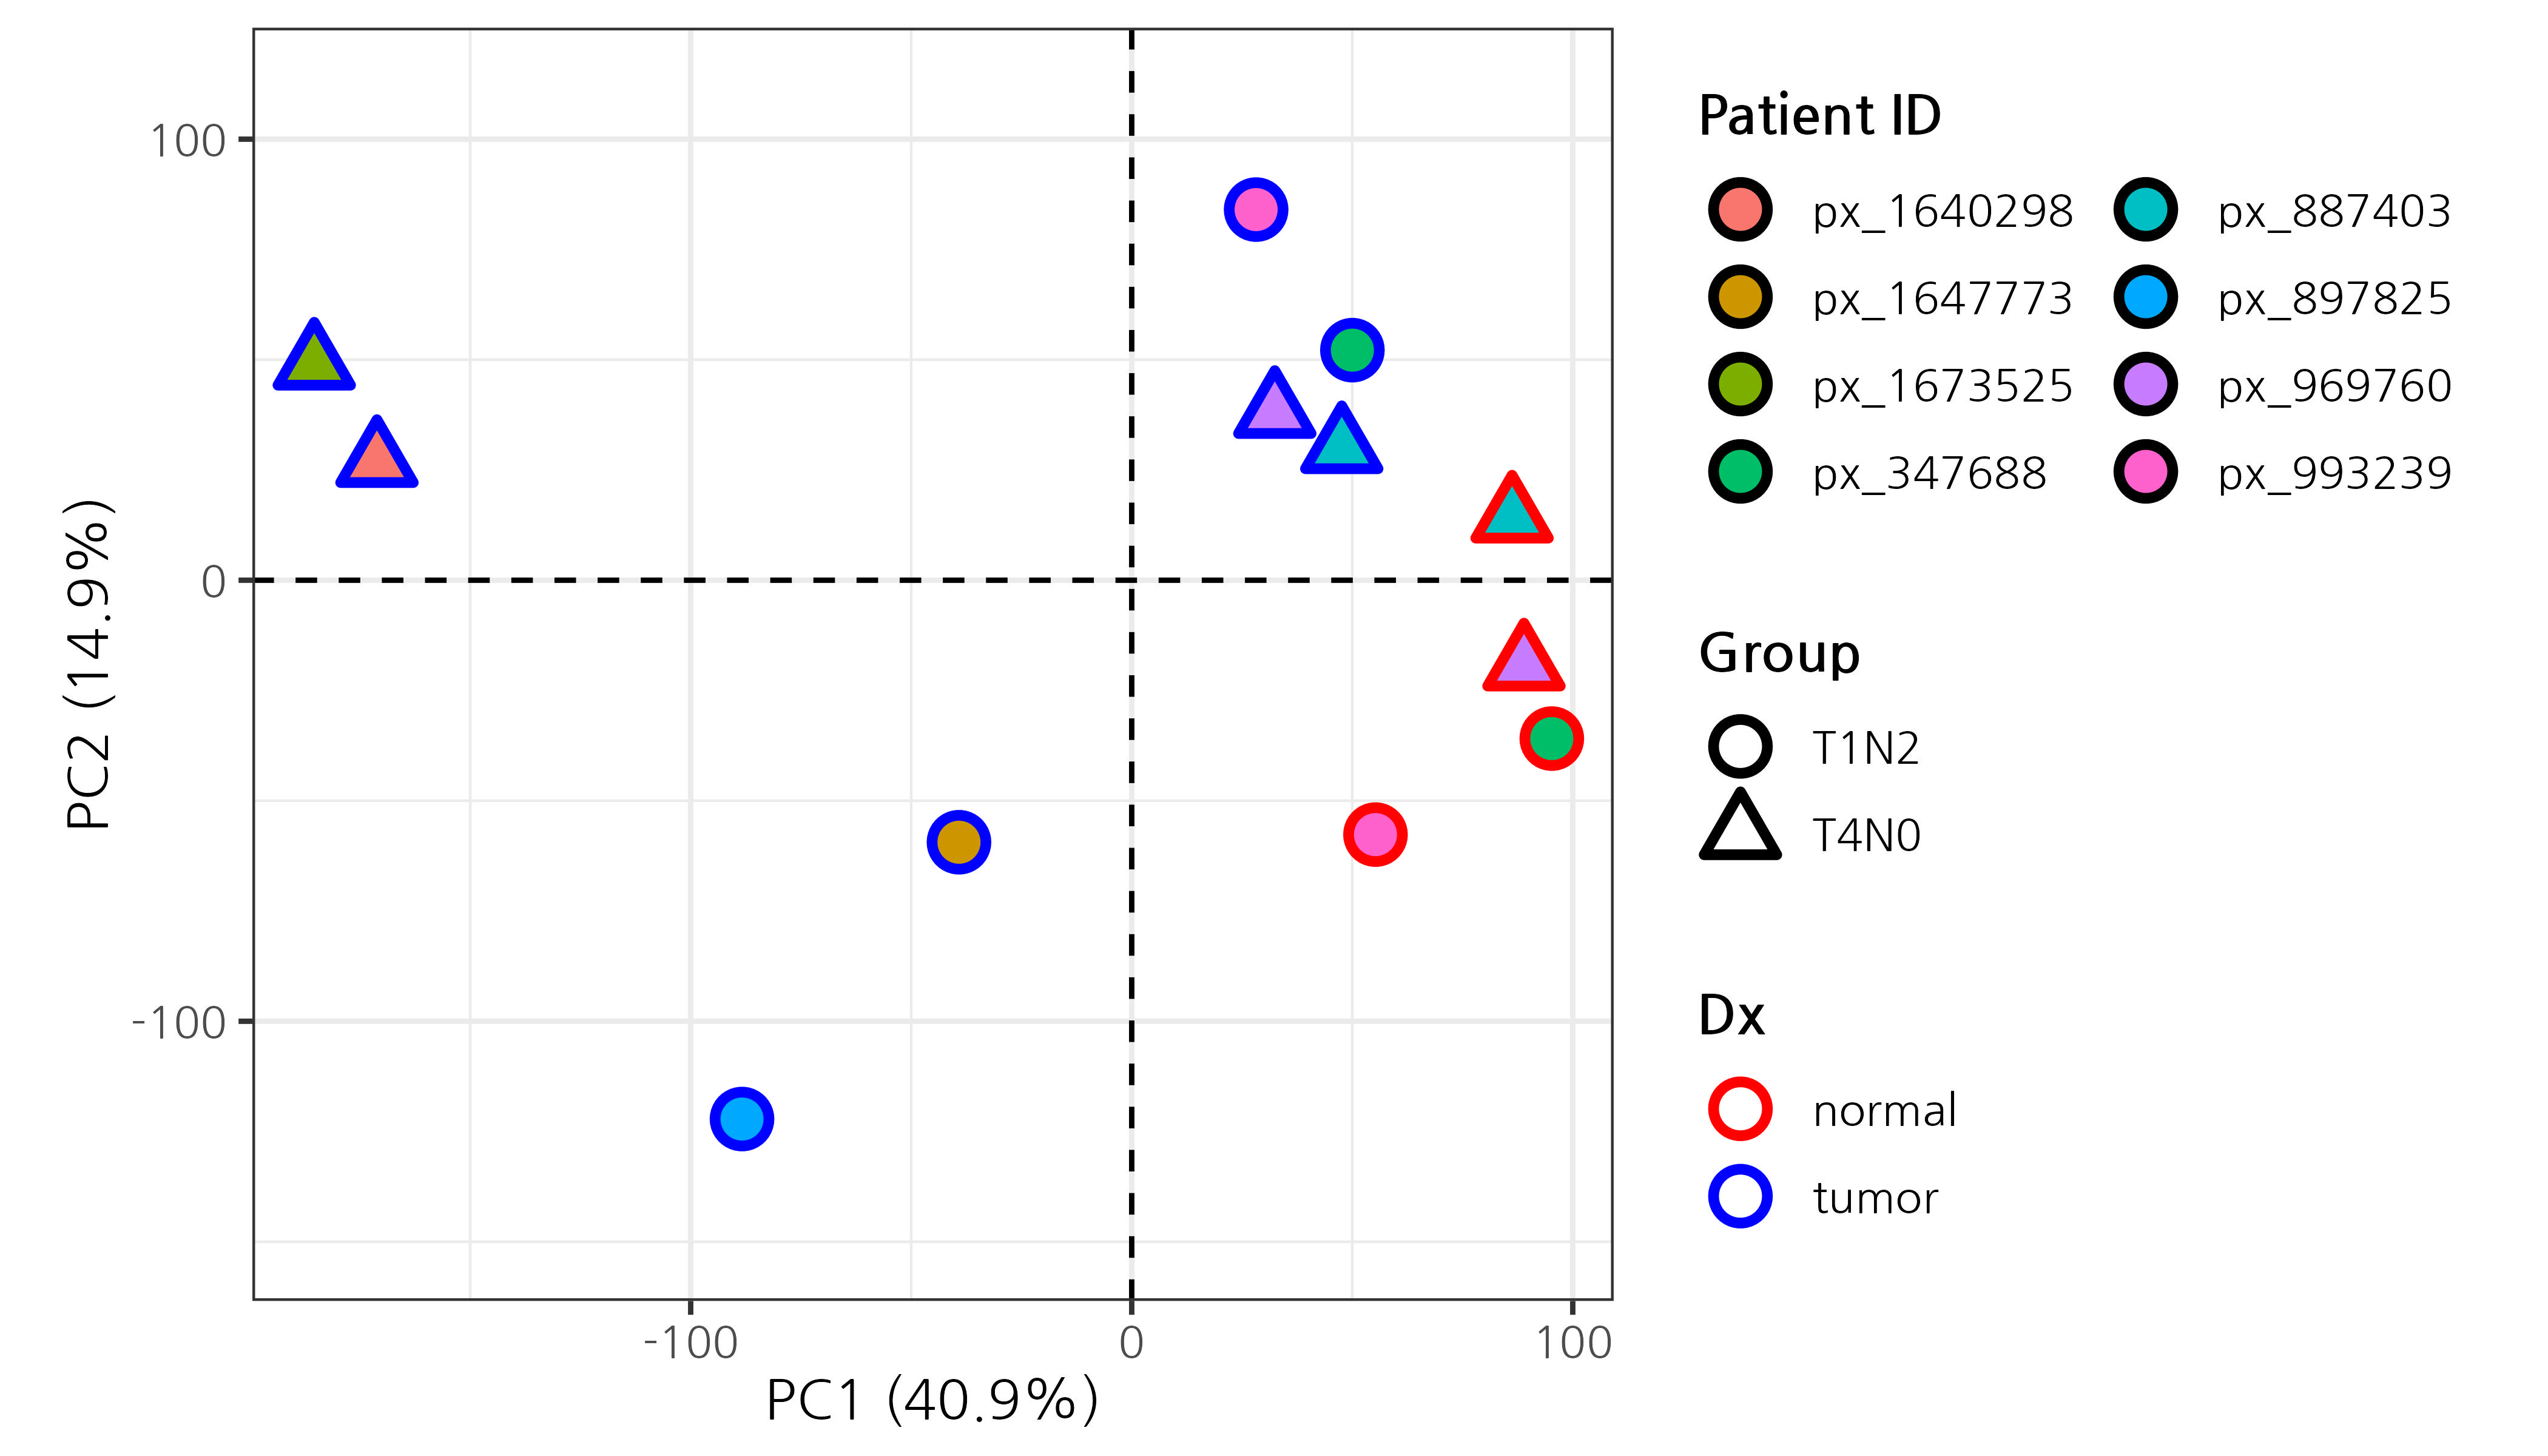
Principal component analysis (PCA) helps visualize sample clustering based on expression profiles. Samples that cluster closely together share similar transcriptomic features.
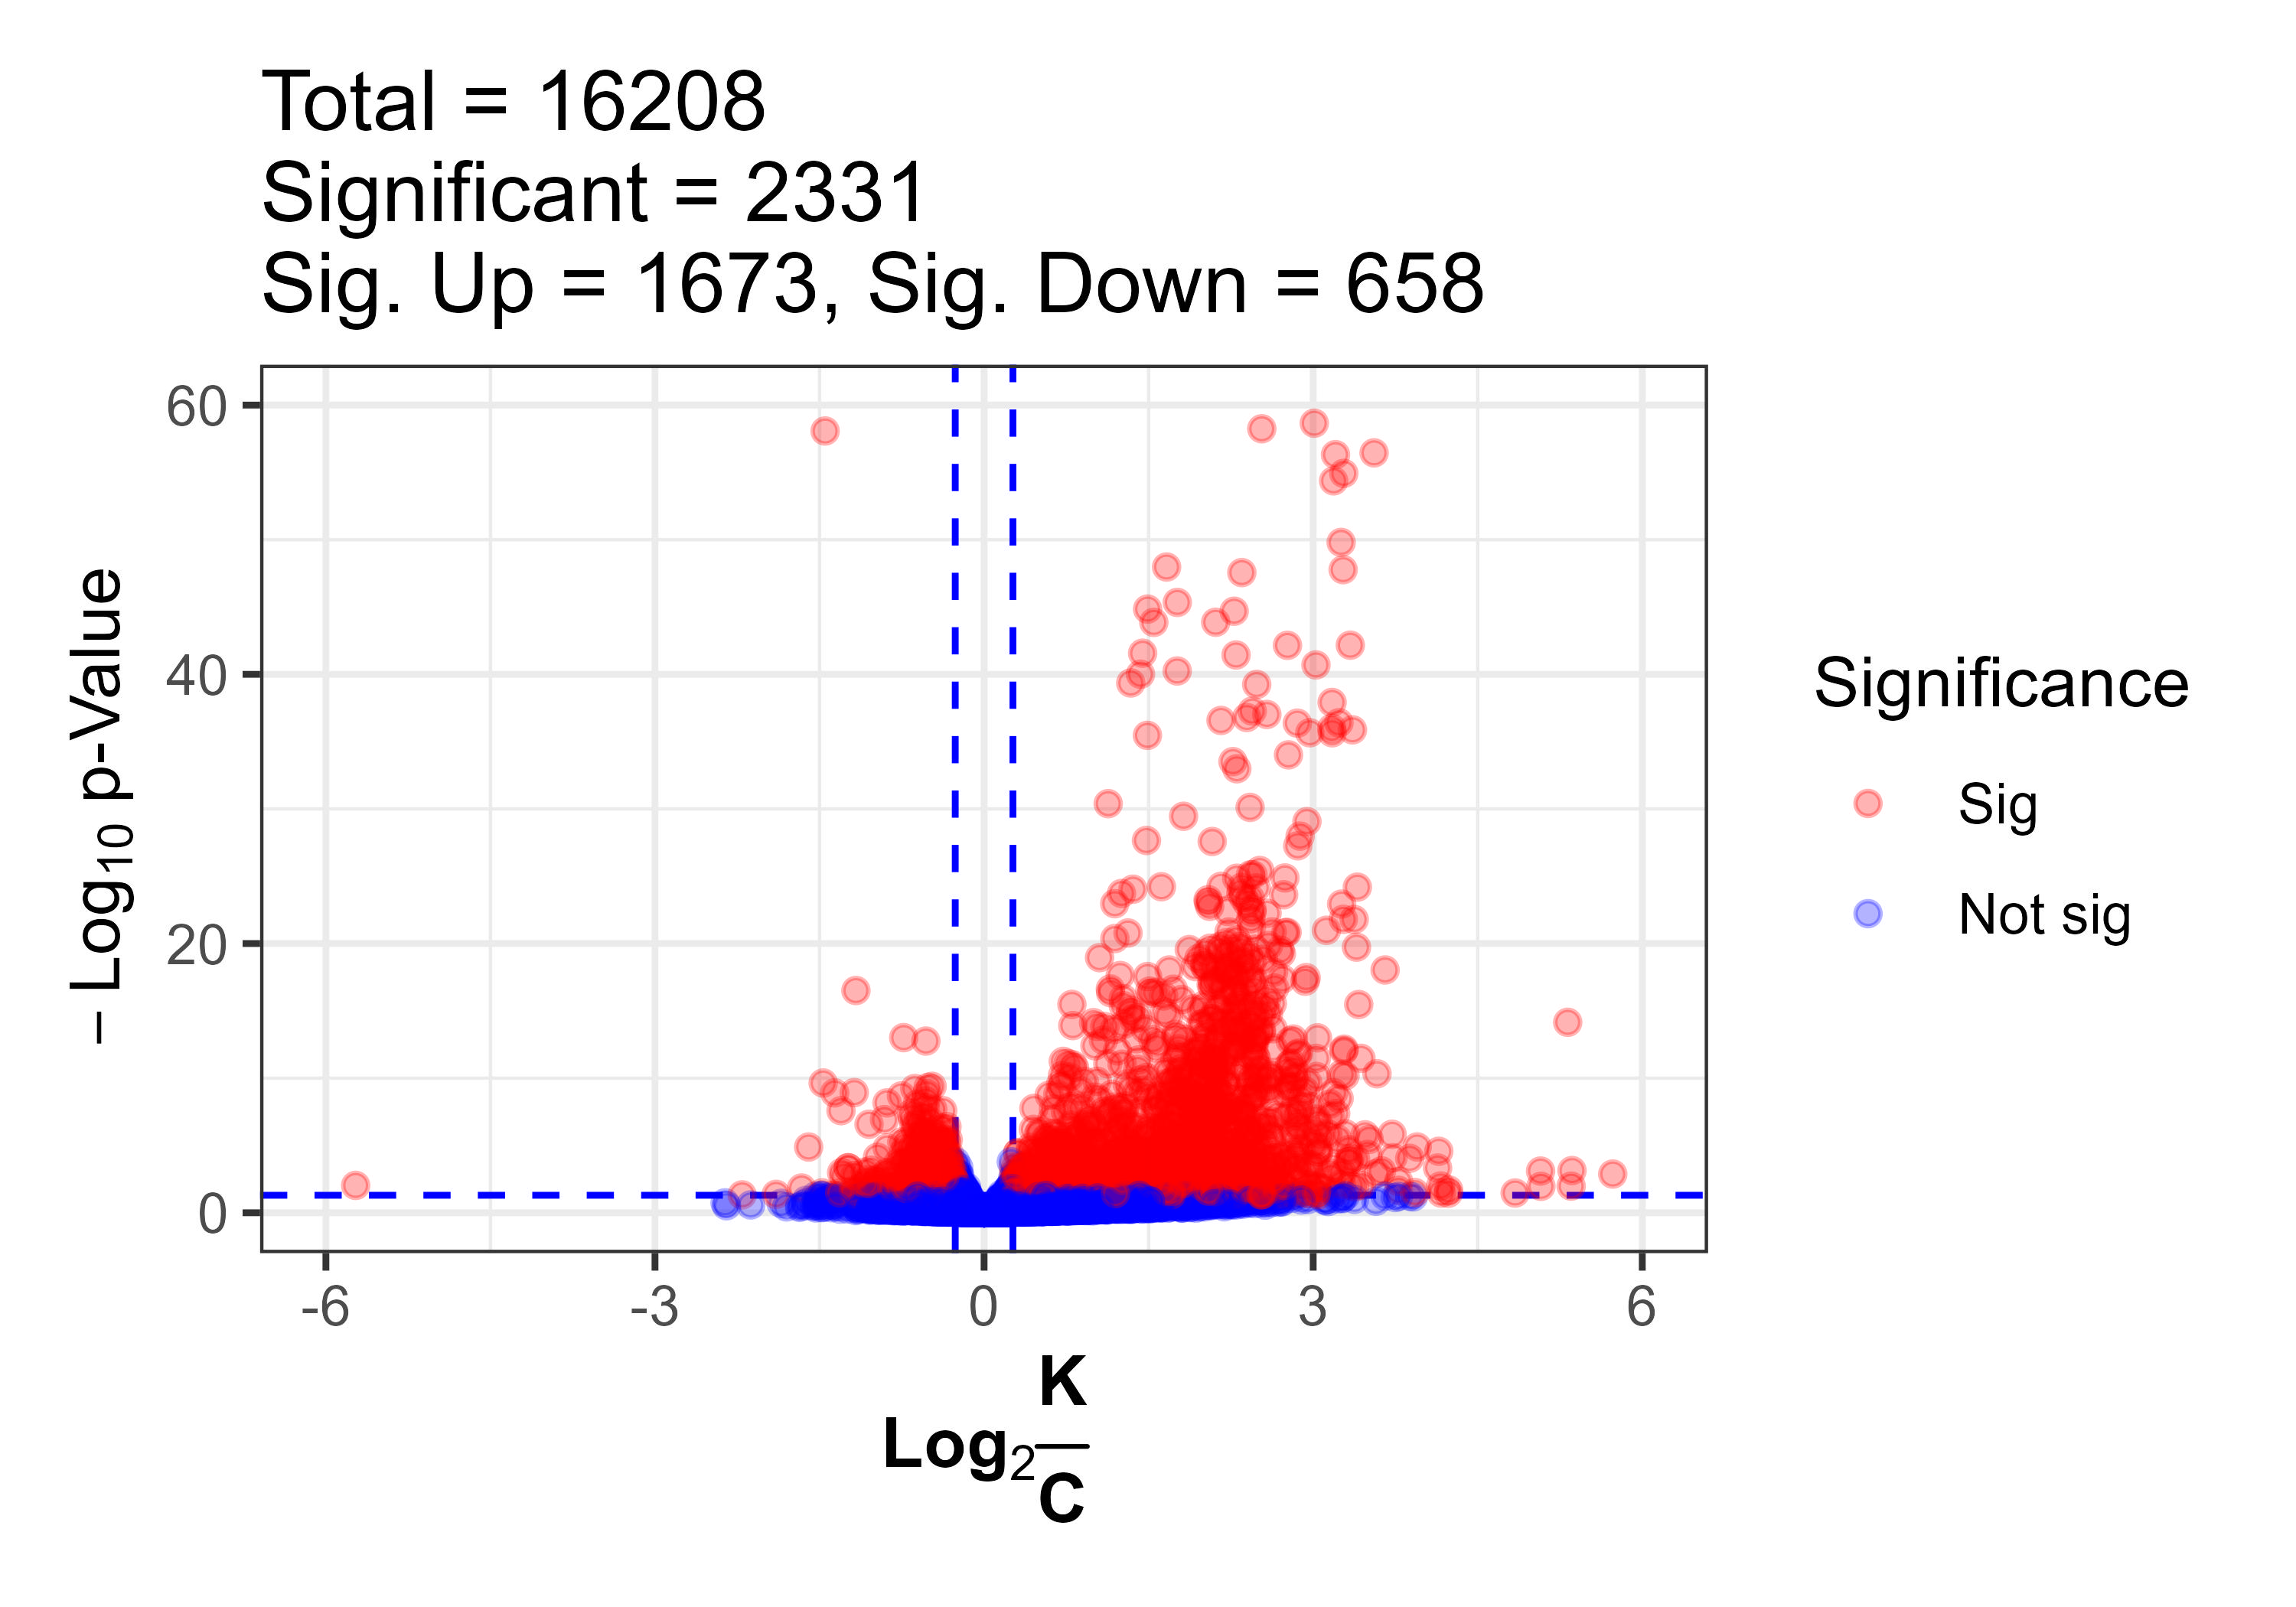
The volcano plot highlights genes that are both statistically significant and biologically meaningful. Genes with large fold-changes and small p-values stand out on either side.
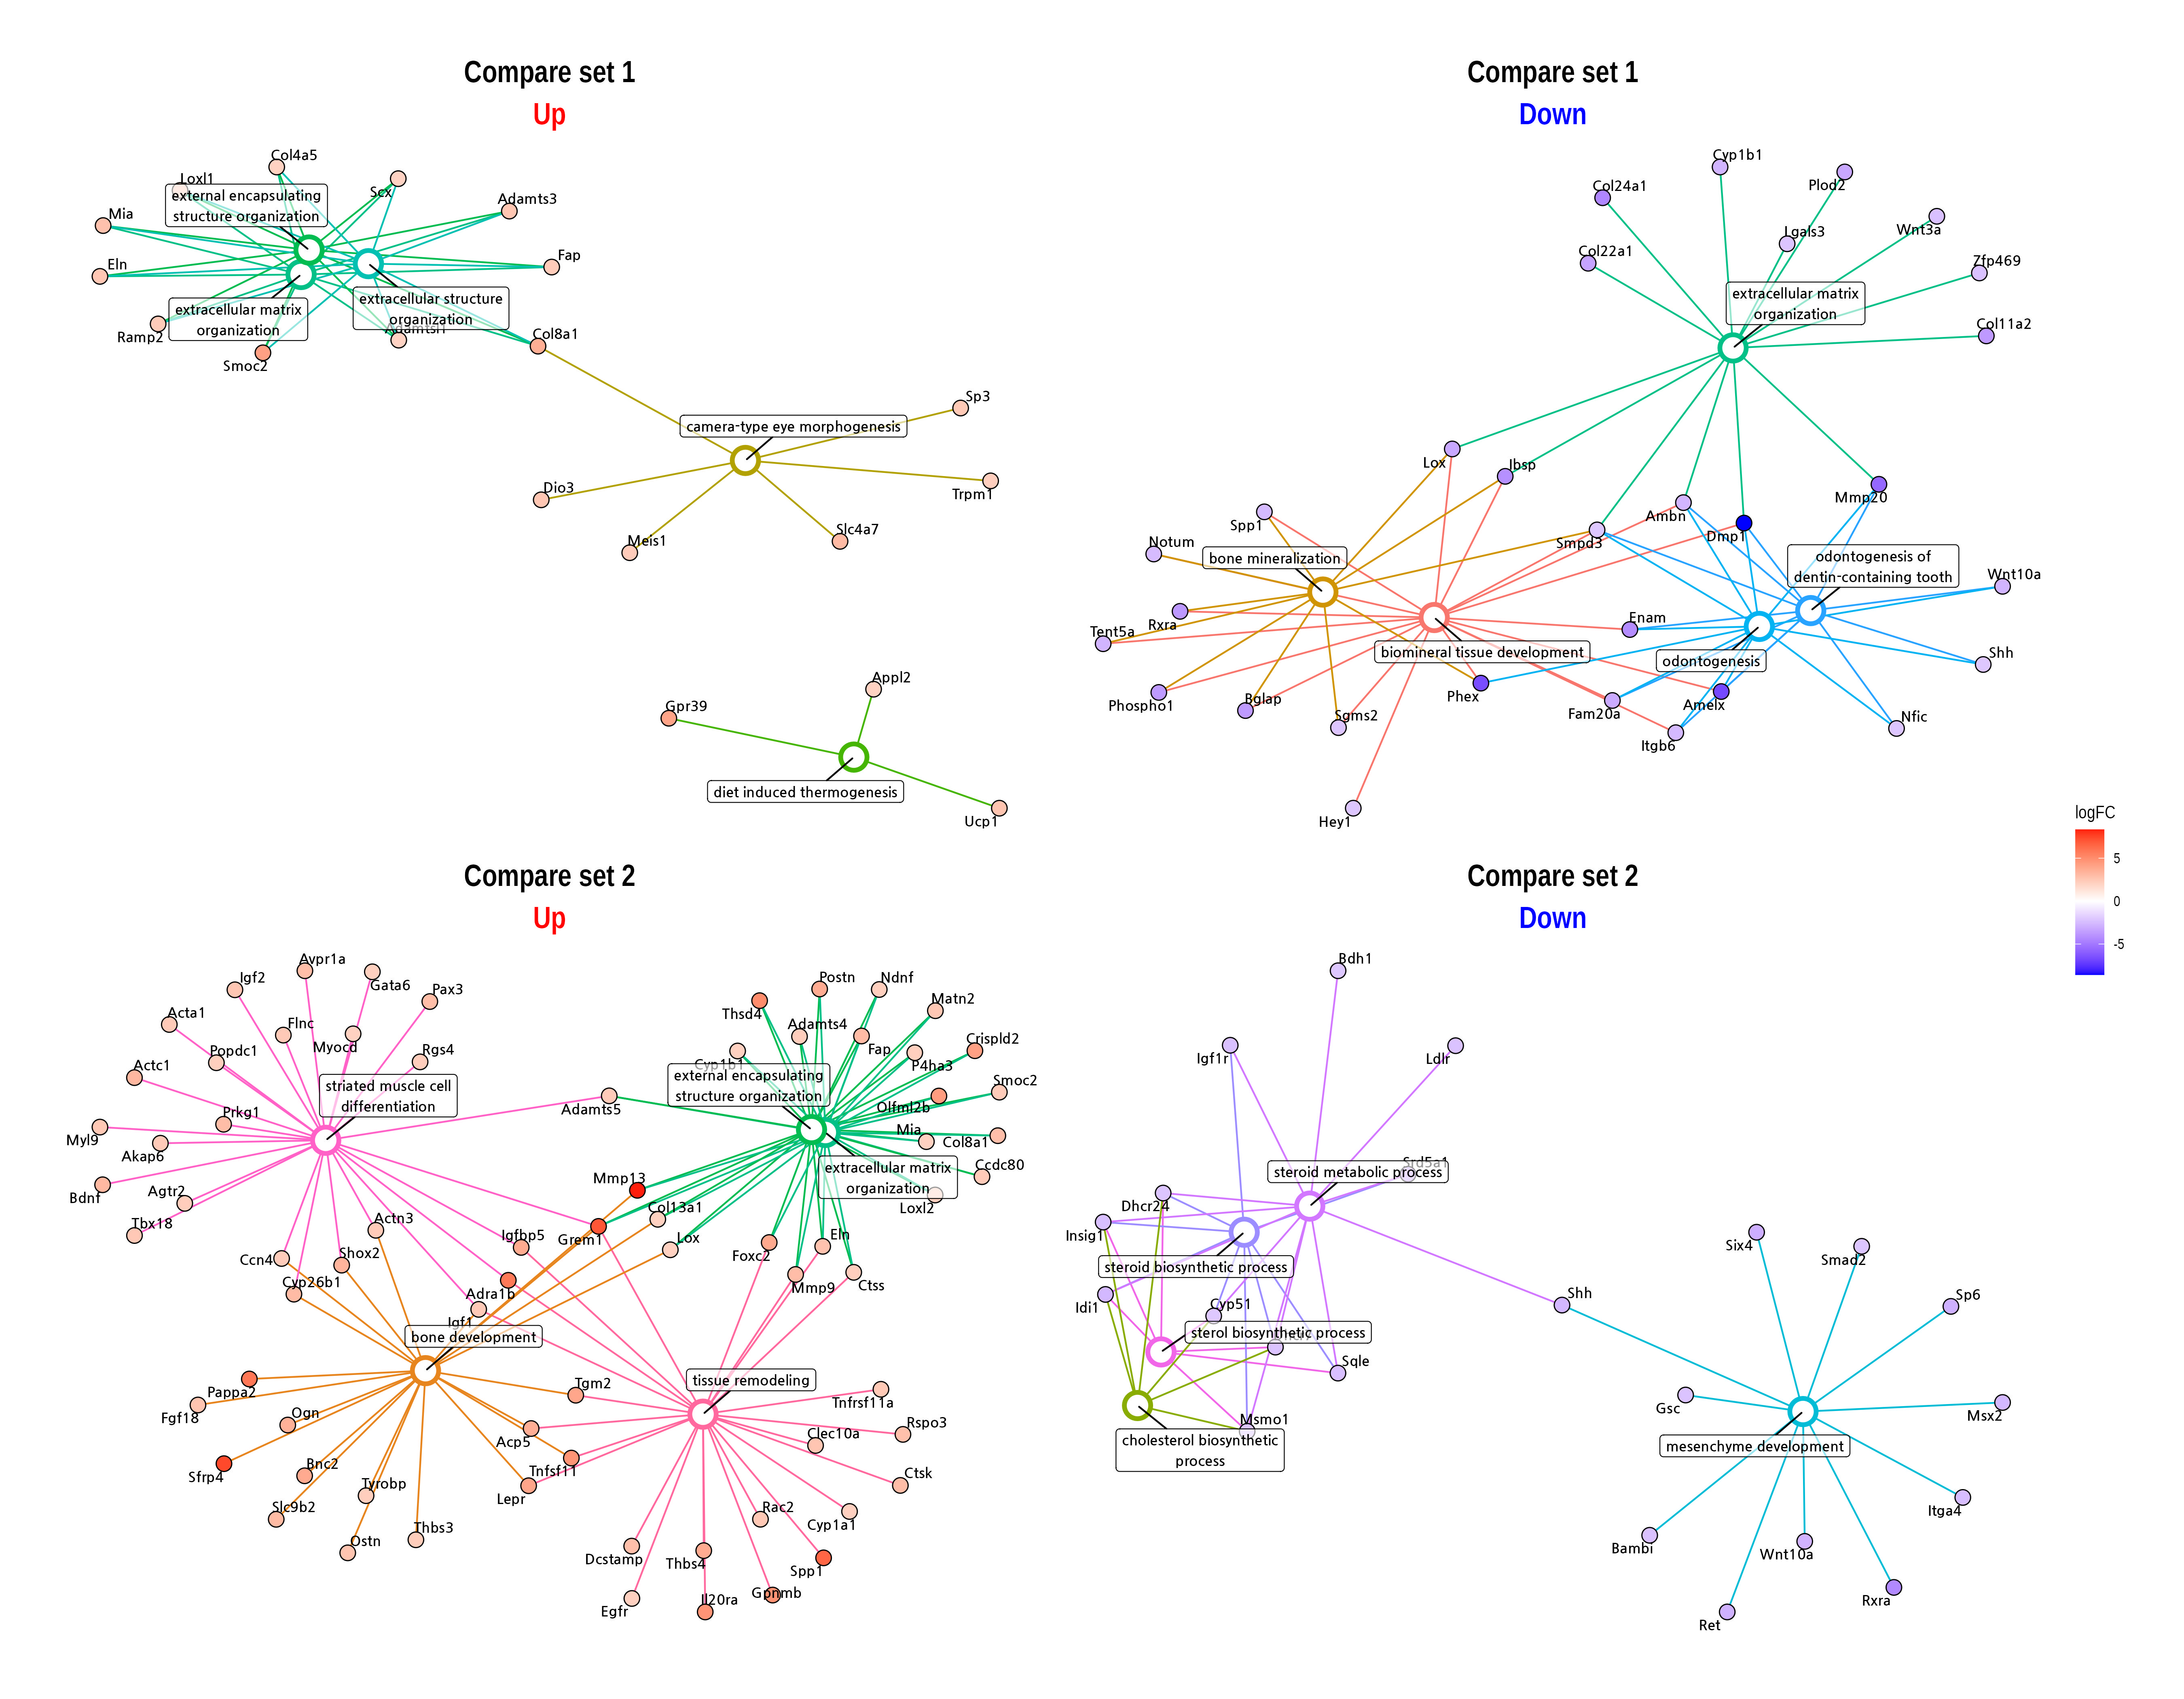
Gene ontology (GO) analysis identifies enriched biological processes, cellular components, and molecular functions among differentially expressed genes. This provides insights into the functional implications of the observed changes.
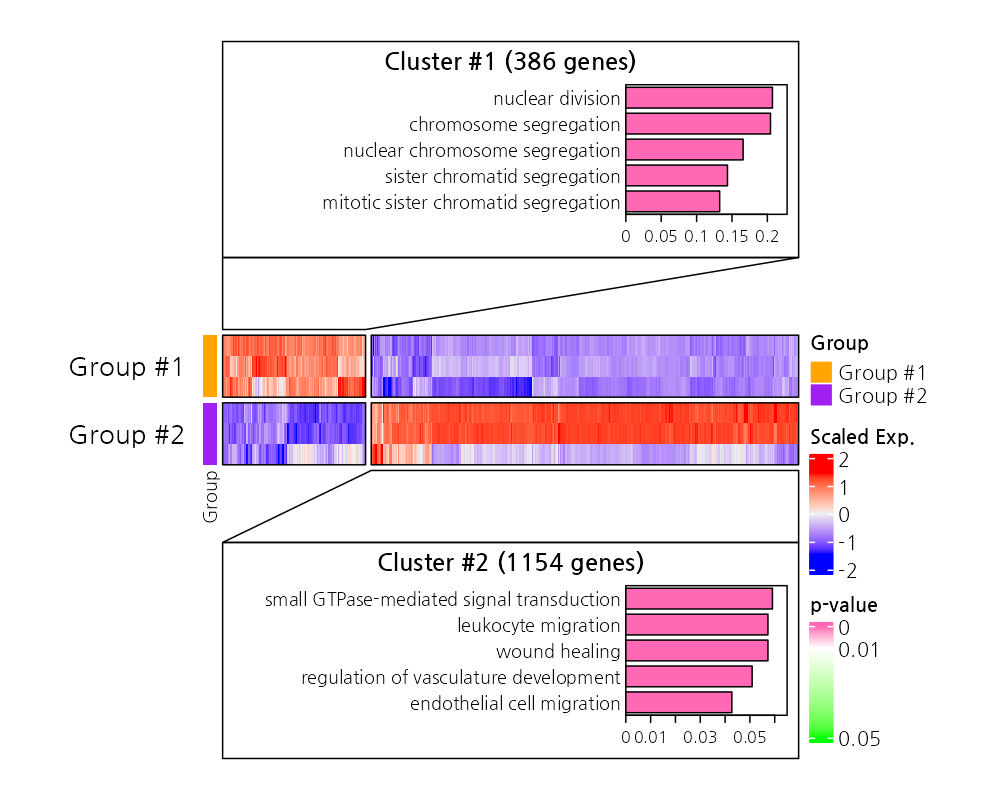
The heatmap visualizes expression patterns of differentially expressed genes across samples, with annotations for enriched GO terms. This allows for quick identification of clusters of co-regulated genes and their associated biological functions.
For detailed options and customization, contact us.