Single-cell RNA-seq
We provide end-to-end single-cell RNA-seq analysis using popular platforms such as 10x Genomics Chromium. Our robust pipeline includes quality control, normalization, clustering, trajectory inference, and cell-type annotation, enabling high-resolution insights into cellular diversity and dynamic gene expression.
Workflow Summary
  ---
config:
    theme: 'base'
    themeVariables:
        fontFamily: 'verdana'
        fontSize: '25px'
---
flowchart LR
    subgraph Preprocessing["`**Preprocessing**`"]
        direction TB
        Raw[Raw Reads]
        Demux[Demultiplexing]
        Align[Alignment]
        Quant[Quantification]
        QC[Quality Control]
        Multi["Multi-sample Integration"]
        Raw --> Demux --> Align --> Quant --> QC --> Multi
    end

    subgraph Basic["`**Basic Analysis**`"]
        direction TB
        Norm[Normalization]
        HVG[Highly Variable Genes]
        Reduce[Dimensionality Reduction]
        Cluster[Clustering]
        Marker[Marker Detection]
        Ann[Cell Type Annotation]
        Vis[Visualization]

        Norm --> HVG --> Reduce --> Cluster --> Marker --> Ann --> Vis
    end

    subgraph Advanced["`**Advanced Analysis**`"]
        direction LR
        GSEA(Gene Set Enrichment)
        Pseudo[Pseudotime Analysis]
        TF[TF Activity Inference]
        Interact[Cell-cell Communication]
        CustomVis[Custom Visualization]
        GSEA --> CustomVis
        Pseudo --> CustomVis
        TF --> CustomVis
        Interact --> CustomVis
    end

    Preprocessing --> Basic --> Advanced
Preprocessing
- Raw Reads: Input raw sequencing data.
- Demultiplexing: Separate reads by cell barcodes.
- Alignment: Map reads to the reference genome.
- Quantification: Generate gene expression matrices.
- Quality Control: Filter low-quality cells and genes.
- Multi-sample Integration: Integrate data from multiple samples.
Basic Analysis
- Normalization: Normalize gene expression data.
- Highly Variable Genes: Identify genes with high variability across cells.
- Dimensionality Reduction: Reduce data complexity (e.g., PCA, t-SNE, UMAP).
- Clustering: Group cells into distinct clusters based on expression profiles.
- Marker Detection: Identify marker genes for each cluster.
- Visualization: Create UMAP/t-SNE plots to visualize clusters.
Advanced Analysis
- Cell Type Annotation: Annotate clusters with known cell types.
- Gene Set Enrichment Analysis (GSEA): Perform enrichment analysis on gene sets.
- Pseudotime Analysis: Infer developmental trajectories of cells.
- Transcription Factor Activity Inference: Analyze TF activity across clusters.
- Cell-cell Communication: Analyze interactions between cell types.
- Custom Visualization: Create custom visualizations tailored to your analysis.
Example
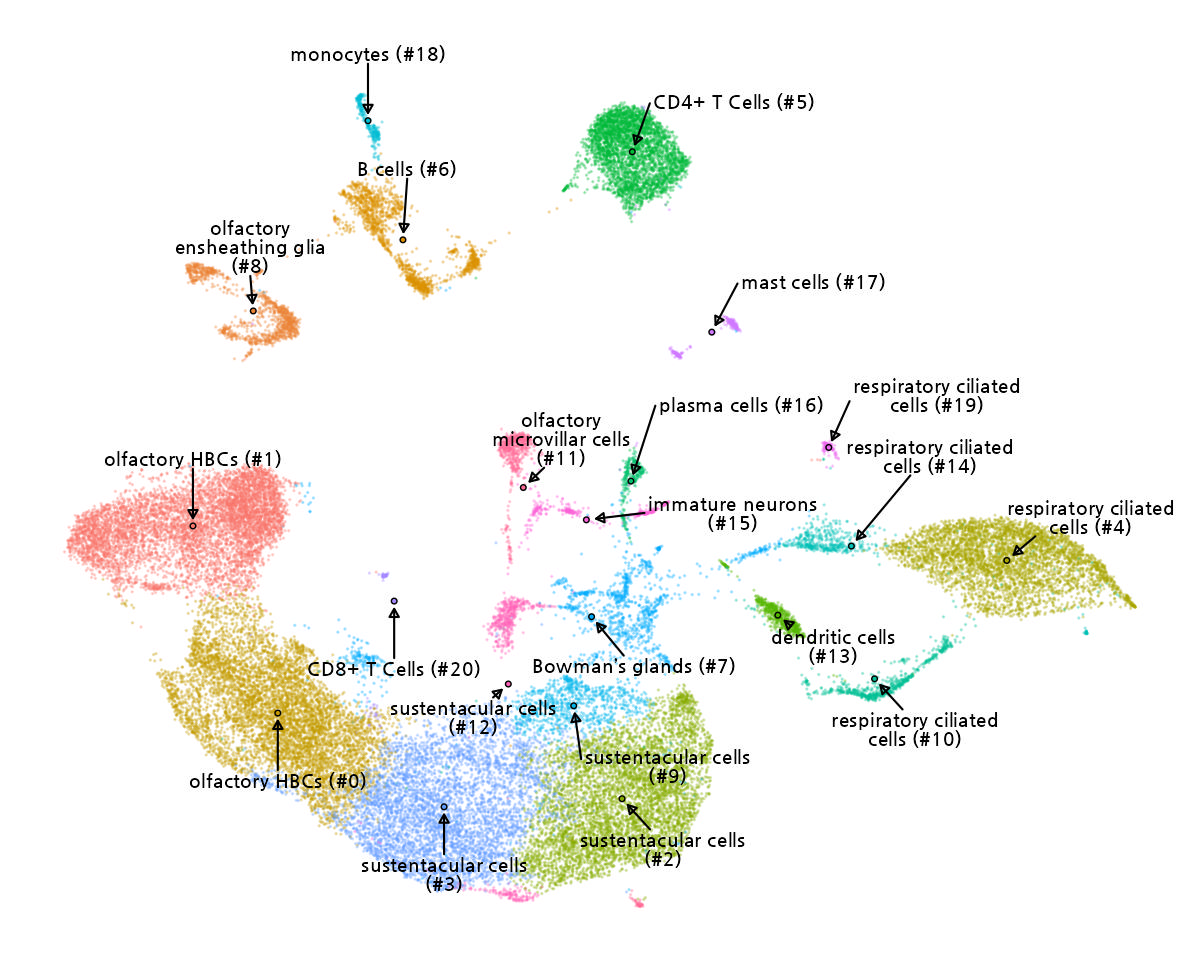
This UMAP plot visualizes the transcriptional landscape of single cells by projecting high-dimensional gene expression data into a two-dimensional space. Each point represents an individual cell, and clustering reflects transcriptional similarity. Cell type annotation was performed based on the expression profiles of known marker genes, using public cell marker databases or user-provided cell marker gene sets.
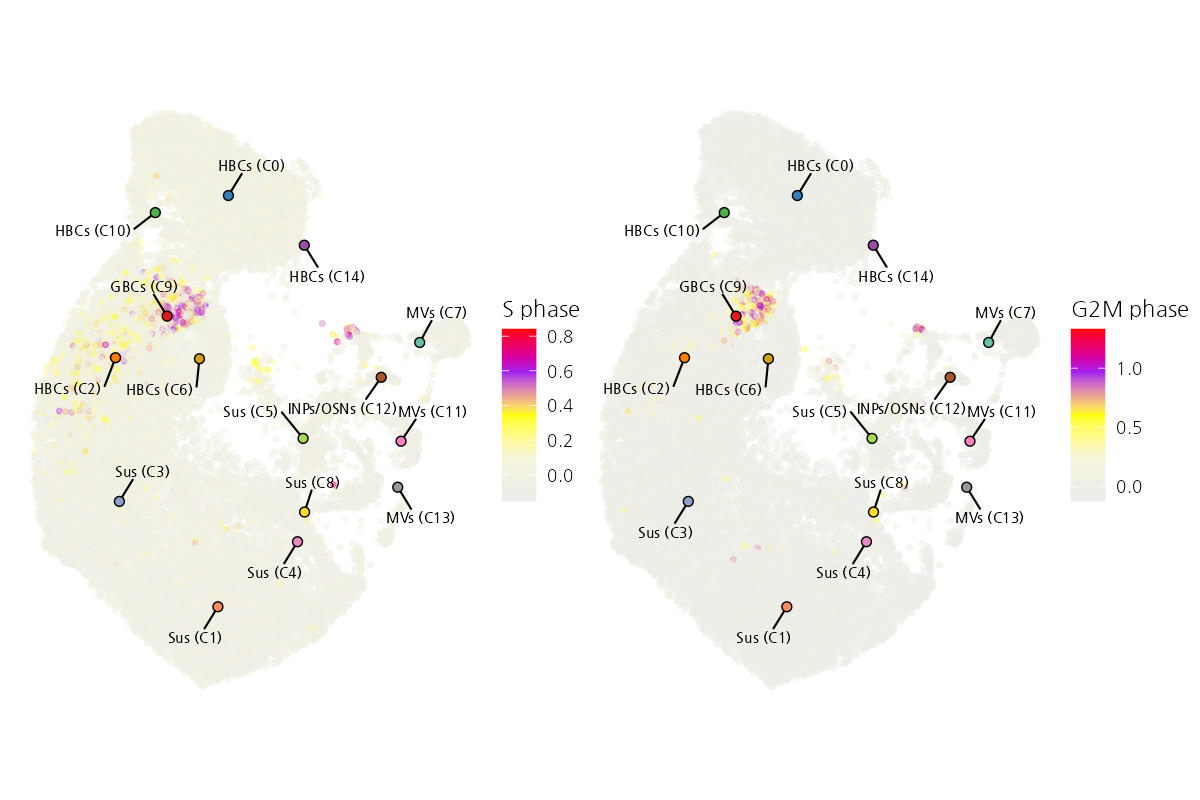
This figure shows a UMAP visualization of cell cycle phase assignment based on single-cell RNA-seq data. The expression of cell cycle-related genes was analyzed to infer the cell cycle state of individual cells. Cells are colored by their S phase (left) and G2/M phase (right) scores, indicating transcriptional activity associated with DNA synthesis and mitosis, respectively.
For detailed options and customization, contact us.